
Social Network Analysis for Targeted Marketing
- enikeevaa2
- Jan 26, 2024
- 10 min read


As the world of marketing becomes increasingly complex, so too do the tools and techniques needed to reach customers effectively. Social network analysis is one such tool that is gaining popularity among marketers looking to better understand and target their audience.
Companies should use social media to advertise instead of general website ads. I will address the significance of social networks in online marketing and provide social network analysis techniques to build a targeted marketing strategy for any product launch. Additionally, I will identify the best channels for reaching our target market. Identify key influencers to reduce advertising costs while maintaining large-scale advertising campaigns.
Digital targeted marketing and advertising is a form of online marketing that uses web-based technologies to reach out to potential customers in a more specific and personal way. By targeting a specific audience with relevant ads, businesses can more effectively draw in new customers and conversions. There are a number of different ways to target an audience online, including through sex, age, location, interests, and friends. Digital targeted marketing and advertising can be an extremely effective way to reach out to potential customers, but it is important to remember that it should be used in conjunction with other forms of marketing and advertising (Wind & Mahajan, 2002).
Social network analysis, on the other hand, is the process of mapping out relationships between individuals and groups. It can be used to identify influencers, measure reach, and track how information flows through a network. This information can be leveraged for marketing purposes in a number of ways. For example, social network analysis can be used to target ads more effectively, identify potential ambassadors for a brand, or understand how a campaign is likely to spread. Additionally, social network analysis can be used to monitor brand sentiment and understand how customers interact with a product or service. By understanding the relationships between individuals and groups, businesses can more effectively market their products and services (Butts, 2008).
Social network data can be used to create a variety of different types of graphs. For example, a connectivity graph can show how different individuals are connected to one another. A breadcrumb trail graph can show the path that a user took through a social network. And a co-occurrence graph can show which individuals are most likely to interact with one another. These graphs can be used to study the behavior of social network users and to identify potential areas of improvement for social networks (Das et al., 2018).
Collecting social network data can be a valuable way to gain insights into people's behaviors and preferences. However, there are a few important factors to consider before starting any data-collection project. First, it is important to clearly define the scope of the project and what kind of data you hope to collect. Second, you will need to decide how you will collect the data. There are many different methods available, but some may be more appropriate than others depending on the specific objectives of your project. Finally, you will need to consider how you will protect the privacy of those who provide their data for your research. By taking these factors into account, you can ensure that your data-collection project will be well-planned and productive. Luckily, the data is collected by Stanford University and was cleaned and organized for any SNA project.
One of the most popular applications of social network analysis is marketing which is the core of this project. By understanding the relationships between individuals, businesses can more effectively target their messages and tailor their content to specific groups. For example, Facebook uses social network analysis to map out the interests of its users and provide them with targeted ads. In a similar vein, Twitter has used social network analysis to study the spread of information about brands and products. By understanding how information flows through social networks, businesses can more effectively promote their products and services. In short, social network analysis has become an indispensable tool for marketing professionals (Doyle, 2007).
As businesses increasingly look for ways to connect with their target audiences, social network analysis (SNA) has emerged as a powerful tool for targeted marketing. SNA is a process of mapping and analyzing the relationships between individuals or groups in order to identify influencers and key opinion leaders. By understanding the structure of social networks, businesses can more effectively reach their target audiences through word-of-mouth marketing and other forms of social influence. Additionally, SNA can help businesses to identify new customer segments and understand how information flows within a given network. With its ability to provide insights into human behavior, SNA is an invaluable tool for businesses that are looking to stay ahead of the competition (Boon-Long & Wongsurawat, 2015).
Social network analysis has become an increasingly popular research tool in recent years. Its potential uses are varied and far-reaching, from understanding the spread of disease to predicting consumer behavior. However, social network analysis also has a number of limitations that should be taken into account when designing research studies. Perhaps the most significant limitation is that social network analysis relies heavily on self-reported data, which can be unreliable. In addition, social network analysis often relies on small samples of people, which can produce skewed results. Finally, social network analysis is limited by its static nature; it can provide insights into current relationships but is less effective at predicting future changes. Given these limitations, social network analysis should be used in conjunction with other research methods in order to produce the most accurate and complete picture possible (Sheshasaayee & Jayamangala, 2017).
In conclusion, social network analysis is a powerful tool that can be used to understand the relationships between individuals and groups. By understanding how people are connected, marketers can more effectively target their advertising and messages. There are a few different ways to collect social network data, and it's important to consider the limitations of this method when using it for marketing purposes. Social network analysis should be used in conjunction with other research methods to create a well-rounded picture of your target market. When used correctly, social network analysis can provide valuable insights into human behavior that can be leveraged to increase sales.
Data Description
The fakebook ego network data set is a collection of Facebook user networks that has been anonymized and made available for academic research. The data excluded information on user profile attributes, and content interactions for privacy (J. McAuley and J. Leskovec, 2012).
The dataset is a CSV file containing two columns and 88235 rows. The first column represents the source node in the network and the column the second column represents the “friend” node. As mentioned, the nodes have been anonymized and instead of the actual names, Facebook named the nodes as numbers starting at 0 and ending at 4038.
Nodes (People)
4039
Edges (Links)
88234
Data Processing/Analysis
In order to analyze the fakebook ego network data set in python, I imported several libraries such as networkx, matplotlib, pandas, etc. After that, I visualized the overall network as shown below:

The labels were removed to fit the network in a reasonable size picture. The blue circle represents the nodes (people) in the network and the lines represent the links (connections) between the nodes. The numbers on the nodes represent the names and as mentioned before, the nodes have been anonymized instead of the actual names, Facebook named the nodes as numbers starting at 0 and ending at 4038.
The first goal of this analysis is to identify key players in this network for digital advertising. Therefore, calculating measures of centrality, such as degree, betweenness, and eigenvector centralities is an ideal method. By calculating these measures, we can begin to understand how the fakebook ego network is structured.
Degree centrality
Degree centrality is a measure of node importance in a network. It is calculated as the number of connections a node has to other nodes in the network. Nodes with a high degree of centrality are considered to be important because they are connected to many other nodes. This makes them influential in the spread of information or ideas throughout the network. In social network analysis, degree centrality is often used to identify opinion leaders or "super-spreaders" of information. These are individuals who have a large number of connections and can therefore reach a large number of people with their messages. Degree centrality can also be used to find cliques, or groups of closely connected individuals, within a network (Das et al., 2018).
Below is the degree centrality scores distribution

Visualizing the degree of centrality distribution can help to reveal patterns and trends in the data, which may not be immediately apparent otherwise. In the graph above, the majority of the nodes have a score lower than 300. I can remove this cluster and focus my analysis on small portion that have the scores more than 300 as shown in the graph below:

Those are the influencers in the network.
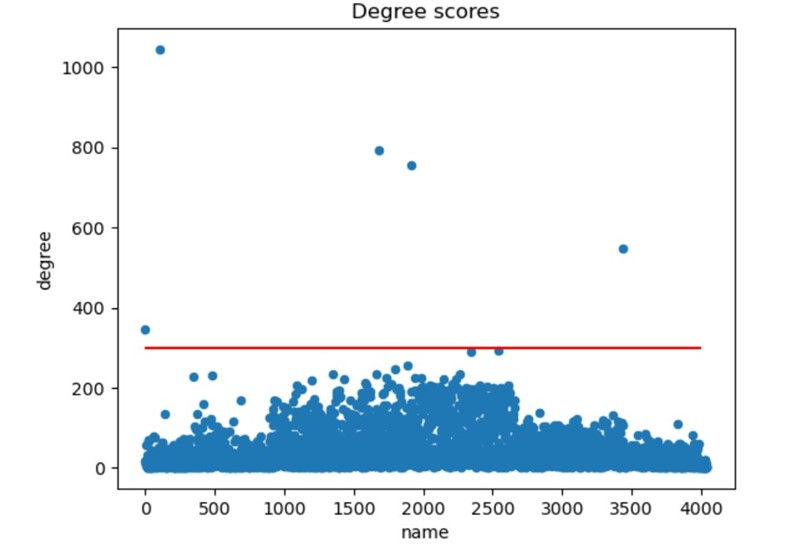
Above, are the nodes we are interested in, and we can summarize them in the table below:
Name | Degree |
107 | 1045 |
1684 | 792 |
1912 | 755 |
3437 | 547 |
0 | 347 |
Let’s visualize the location of these nodes in the actual network (labels were removed). The size and color should indicate those nodes.

Betweenness Centrality
Betweenness centrality is defined as the number of shortest paths between two nodes that pass through a given node. Nodes with high betweenness centrality are often referred to as "bridges" or "hubs." They play an important role in communication and information flow within a network. Betweenness centrality can be used to identify potential bottlenecks and hubs in a network. It can also be used to detect unusual patterns of communication, such as cliques and backbones (Das et al., 2018).
When visualizing the betweenness scores, we can see the majority of the scores are below 0.1.

Name | Betweenness |
107 | 0.48 |
1684 | 0.33 |
3437 | 0.23 |
1912 | 0.22 |
1085 | 0.14 |
0 | 0.14 |
We can visualize their locations in the network as follow:

Eigenvector Centrality
Eigenvector centrality is based on the principle that a node is more important if it is connected to other important nodes. The eigenvector centrality of a node is the weight that the node gives to its neighbors. The weight is equal to the sum of the weights of the neighbors divided by the number of neighbors. The eigenvector centrality of a node can be thought of as the influence that the node has on its neighbors. Nodes with high eigenvector centrality are said to be influential in the network. Nodes with low eigenvector centrality are said to be less influential (Das et al., 2018).
When visualizing eigenvector scores, we can see a huge difference when compared to other centralities.

Maybe the point that looks like it’s an outlier is the one I’m looking for!
name eigenvector
1912 0.09
The reason I excluded many of these nodes is that one of the ultimate goals of this study is to minimize cost.
As we can see the nodes here seem to show importance because the majority are connected to the influential nodes in the network.

Results
1- From the degree centrality, we can conclude that nodes 107, 1684, 1912, 3437, and 0 are the most important nodes in the network.
2- From the degree centrality, we can conclude that nodes 107, 1684, 3437, 1912, 1085, and 0 are the most important nodes in the network.
3- From the eigenvector centrality, we can conclude that node 1912 is the most important node in the network.
As final results, nodes 107, 1684, 1912, 3437, and 0 are the key players in the Facebook network. Why should you care?
This study analyzed 4039 nodes in the Facebook network and found that there are five key players, "supernodes," that play a significant role in the network. These supernodes are essential to keeping the network cohesive and functioning properly. Without them, the number of connections between users would drop dramatically, and communication would be much slower.
For example, if your business sells products that would appeal to parents, you could target ads for users who are in parenting groups. Alternatively, if you sell products that would appeal to people who are interested in fitness, you could target ads at users who are members of fitness groups. By targeting your ads carefully, you can ensure that they are seen by the people who are most likely to be interested in your products or services.
On average Facebook ads cost around $12 per impression or $0.97 per click and it will run general ads that do not target the specific audience you need for your product (Webfx, 2022).
On the other hand, Facebook influencers with 1,000–10,000 followers which cost $25 - $250 per ad (Geyser, 2022). For one, influencers usually have a higher level of engagement with their followers than most websites do. Additionally, social media platforms allow for more personal interaction between the influencer and their followers, which can make the endorsements more believable. Finally, influencers typically have a more diverse audience than most websites, meaning that they can reach a wider range of potential customers. Ultimately, social media influencers offer a number of advantages that make them more effective at advertising than traditional websites.
Back to the results, it would cost $1250 to advertise using influencers with a high possibility of reaching over 4000 people in one day for this particular network. While it would cost $3880 (ad per click) to reach 4000 people. This can cut costs by more than 60%.
Summary/Conclusion
Using social network analysis to identify key nodes is a great strategy for businesses that want to successfully market their products and services.
Power users and super connectors are often highly active on social media. They typically have large networks of friends and followers, and they frequently share content with their networks. As a result, they have the potential to reach a large number of people with advertising and marketing messages.
In order to successfully use social network analysis to identify key nodes, businesses need to have a good understanding of the structure of social networks. They also need to have access to data about social networks. Once businesses have identified the key nodes in a social network, they can then begin targeting them with advertising and marketing messages.
References
Boon-Long, S., & Wongsurawat, W. (2015). Social media marketing evaluation using social network comments as an indicator for identifying consumer purchasing decision effectiveness. Journal of Direct, Data and Digital Marketing Practice, 17(2), 130-149.
Butts, C. T. (2008). Social network analysis with sna. Journal of statistical software, 24, 1-51.
Das, K., Samanta, S., & Pal, M. (2018). Study on centrality measures in social networks: a survey. Social network analysis and mining, 8(1), 1-11.
Doyle, S. (2007). The role of social networks in marketing. Journal of Database Marketing & Customer Strategy Management, 15(1), 60-64.
Sheshasaayee, A., & Jayamangala, H. (2017). A study on the new approaches for social network based recommendations in digital marketing. 2017 International Conference on Innovative Mechanisms for Industry Applications (ICIMIA),
Wind, J., & Mahajan, V. (2002). Digital marketing. Symphonya. Emerging Issues in Management(1), 43-54.
How much does facebook advertising cost in 2022? WebFX. (2022, August 12). Retrieved October 11, 2022, from https://www.webfx.com/social-media/pricing/how-much-does-facebook-advertising-cost/
J. McAuley and J. Leskovec. Learning to Discover Social Circles in Ego Networks. NIPS, 2012.
Geyser, W. (2022, August 1). Influencer rates: How much do influencers really cost in 2022? Influencer Marketing Hub. Retrieved October 11, 2022, from https://influencermarketinghub.com/influencer-rates/

Comments